 |
|
|
Spectrum visualization window
This window provides visualization of vibrational or TDDFT spectrum.
The "Broaden lines" checkbox enables Lorentzian or Gaussian
broadening of spectral lines, which facilitates comparison of calculated
spectrum with the experimental one. The "Interpolation
coordinates" button allows one to customize the X coordinates of the
calculated contour of broadened lines. The contour values can be shown
and exported into another application by the "Export values"
button.
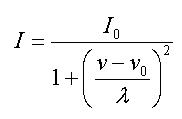
The contour of spectral lines determined by Lorentzian broadening is
calculated by this formula:
The
Gaussian broadening is described by this formula:
Here
λ=1/2 of spectral width
on 1/2
height
Chemcraft can visualize spectra from PCGAMESS output files with
mcqdpt2 computations. In these spectra, the wavenumbers are calculated from
E(MP2) energy difference between the lowest state and other states, and the
intensities are calculated by this formula:
Where TD - norm of radiative transition dipole moment between state
#1 and other states, ∆E - energy difference between the state #1 and
other states. Raman intensities computation By default, Gaussian and other QC software computes raman activities for vibrational spectra, which are not the intensities. Chemcraft can convert these activities into intensities, which can be directly compared with the experimental intensities. The following formula for conversion is used:
Here Si are the raman activities. By default they are printed in A4/AMU in Gaussian, and Chemcraft converts their units into sm4/kg for further calculation. vi is the frequency of the ith band, v0 is the frequency of the laser excitation line (of the incident laser), T is the temperature in K. The fundamental constants used for calculation are: 1
AMU (atomic mass unit)=
1.66053878 × 10- h=6.62606896
x 10-34 Joule*sec c=2.99792458
x 1010 cm/sec k=1.3806504
x 10-23 Joules/Kelvin
Note
that in Chemcraft the frequency of the laser excitation line is typed in cm-
The
formula for intensities calculation was taken from the following papers: P.L.
Polavarapu, Ab initio vibrational Raman and Raman optical activity spectra,
J. Phys. Chem. 94 (1990) 8106–8112. V.
Krishnakumar, G. Keresztury, T. Sundius, R. Ramasamy, Simulation of IR and Raman
spectra based on scaled DFT force fields: a case study of 2- (methylthio)benzonitrile,
with emphasis on band assignment, J. Mol. Struct. 702
(2004) 9–21. D.
Michalska, R. Wysokinski, The prediction of Raman spectra of platinum (II) anticancer
drugs by density functional theory, Chem. Phys. Lett. 403 (2005) 211–217. Example
of a paper which used this formula: Igor
Reva. Comment on ‘‘Density functional theory studies on molecular
structure, vibrational
spectra and electronic properties of cyanuric acid’’. Spectrochimica
Acta Part A: Molecular and Biomolecular Spectroscopy. 2015, 22 June 2015.
http://dx.doi.org/10.1016/j.saa.2015.06.070
| |


